
Seawater exposure and internal moisture uptake are different quantities. This exercise follows the thickness-dependent response of a balsa core using its linked transport inputs.
Open this exercise in Workbench
Prepare the baseline
Inspect the balsa material, initial state, seawater boundary convention, saturation and diffusivity, with their units and provenance. Run the supplied baseline before changing exposure duration or thickness. Do not substitute ambient relative humidity for a liquid-water boundary without checking the model mapping.
Worked procedure
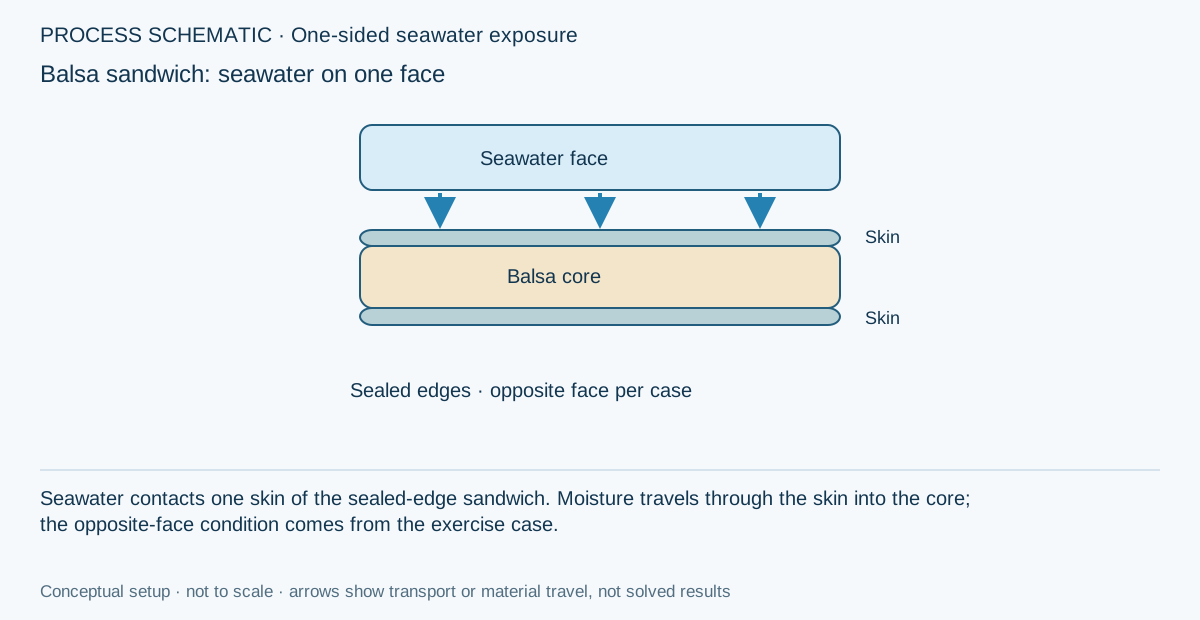
1. Inspect the 300 × 300 mm panel and its two 4 mm glass/epoxy skins. Each skin has sixteen 0.25 mm plies in [0/+45/−45/90]2s; the end-grain balsa core is 25.4 mm thick. Sealed edges reduce this demonstration to through-thickness diffusion.
2. Review the explicit Layered activity inputs on the moisture case. Both materials start equilibrated at activity 0.5. The lower seawater face is held at assumed activity 0.98, while the upper air face remains at 0.5. These constant face activities override the legacy cycle humidity column; cycle time still controls duration.
3. Run the study and inspect the thickness profiles at days 0, 7, 30, 90 and 180. Moisture content is percent of each material’s dry mass; a jump between skin and core is consistent with their different sorption capacities, not an interface leak.
4. Inspect the layer mass table and total mass gain relative to the conditioned initial state. Compare 65 and 129 nodes. Keep all assumed properties with exported results and GUI screenshots.
Review checkpoints
The total thickness is 33.4 mm and duration is 259200 minutes (180 days).
Initial skin moisture is 0.75% and initial core moisture is 15% on a dry-mass basis. Initial mass gain is zero.
The 20°C temperature is fixed through the assumed diffusivities; no temperature dependence is solved.
Model limits
Illustrative linear-sorption diffusion only. Skin D=1e−12 m²/s, saturation=1.5%, dry density=1900 kg/m³; balsa D=1e−10 m²/s, saturation=30%, dry density=150 kg/m³. No capillary flow, salt transport, defects, edge ingress, degradation or service-life validation. Swelling coefficients are explicitly zero: stress/warpage predictions are not part of this exercise. Elastic properties are placeholders for the shared laminate workflow.
Interpret the comparison
Compare surface and core concentration over time. Explain the diffusion length and equilibration trend using the supplied model. Salinity-dependent transport, degradation and strength loss require their own calibrated laws; they are not implied by a seawater label.
How information passes between models
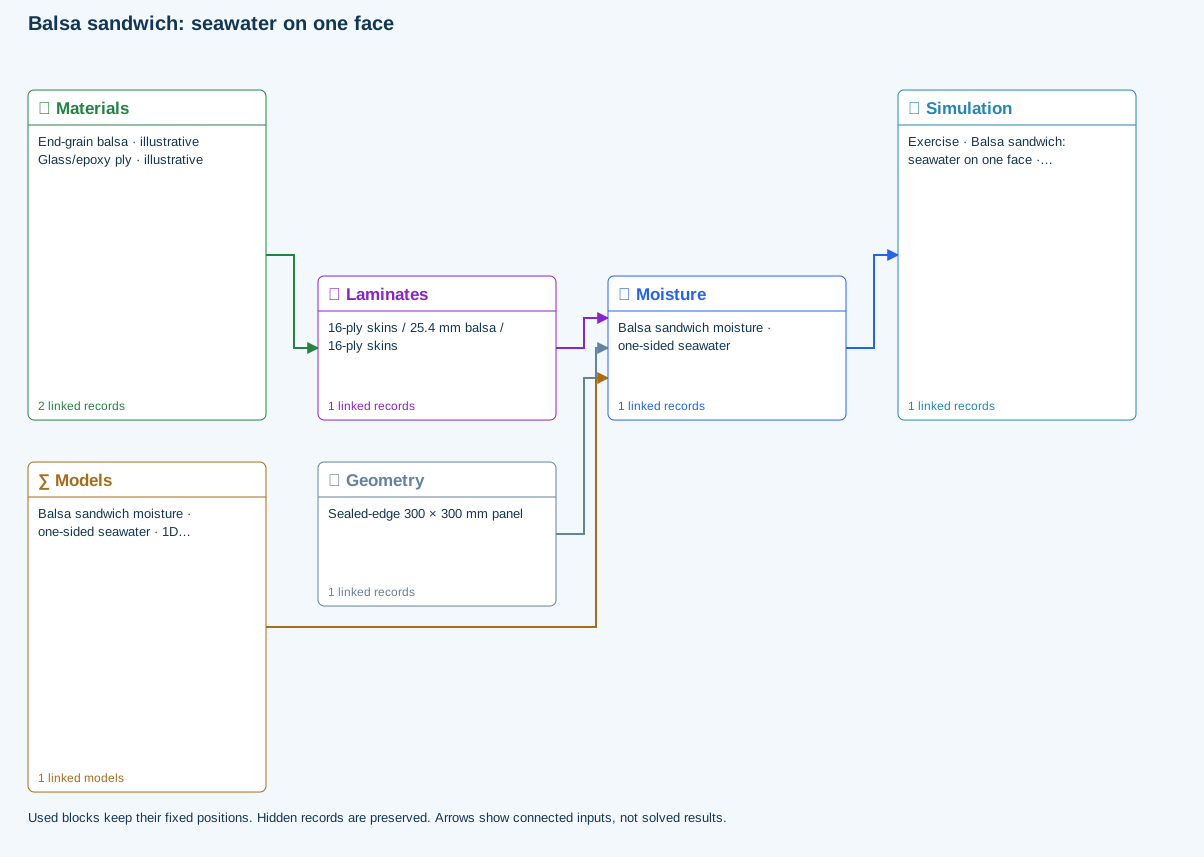
Materials → Laminates: Stored ply stiffness, strength, density and expansion properties.
Moisture → Simulation: SIMULATION selects this case and its analysis model; the case owns its applicable cycle and input references.
Laminates → Moisture: Ply angles and thicknesses, stiffness, mass and ply properties.
Geometry → Moisture: Part shape and dimensions, thickness or section definition, and model-specific geometric inputs. Each selected case consumes only the dimensions its model supports.
Models → Moisture: Applied model assignment: 1D transient moisture diffusion. Model parameters and formulation are used by Moisture.
Further reading and evidence
Review the recorded validation scope. Retain the original inputs and solver notices with the results. Representative teaching data are not design allowables.
References and source sections
References are retained with the formulations they support. Software instructions describe implementation scope; a cited source does not establish independent validation of a CDS calculation.